Alert Function Hijacking
Mon 9th Nov 20
When I'm testing a site for Cross-Site Scripting, if I come across a page with a large number of inputs, or inputs that are redisplayed across the rest of the site, I usually use alert boxes with the name of the input, or some other unique identifier, so when an alert pops up I know the source and can tie the input to the output.
I did this on a recent test but hit a problem. On one page, an alert came up related to the username field, but the page had at least eight copies of the name on it. On a traditional HTML page I could simply view the source and spot which one caused the alert, but this was a "modern" page and the HTML was only a template, all the content was loaded into the DOM through some very obscure JavaScript. All the names appeared to be correctly encoded and were displayed in full with the injected content visible, but something had obviously been messed up somewhere.
My first reaction was to be lazy and tell the developers that they had XSS on the page and leave it up to them to work out which field it was, but I don't like doing that, I'd rather give them as much information about an issue as possible.
As I was thinking about it, I remembered watching The ECMA And The Chakra by Natalie Silvanovich. In it, Natalie talks about all sorts of advanced JavaScript techniques, but one of the more basic things she reminded me of, is that everything in JavaScript can be overridden, even built in functions, so why not overwrite the alert function with one of my own. What good would that do? Well, if I combined it with the debugger function, I could have the code halt when the alert was called and then work out where it was by looking at the call stack.
The function would be would be as follows:
function alert (x) {
    console.log ("Custom alert called");
    debugger;
}
I added the output just in case the debugger call failed for some reason, at least I would catch the logging as it went past.
If you are wondering how I injected my new alert function, that bit is easy, both Burp and ZAP allow you to intercept page responses as well as requests. Enable response interception in the proxy, add the custom function at the start of the page so it gets in before anything else runs, and then let nature take its course. As soon as the XSS triggers, the alert function is called, the debugger function triggers the breakpoint, and by examining the call stack, it is easy to see which of the eight instances was the vulnerable one.
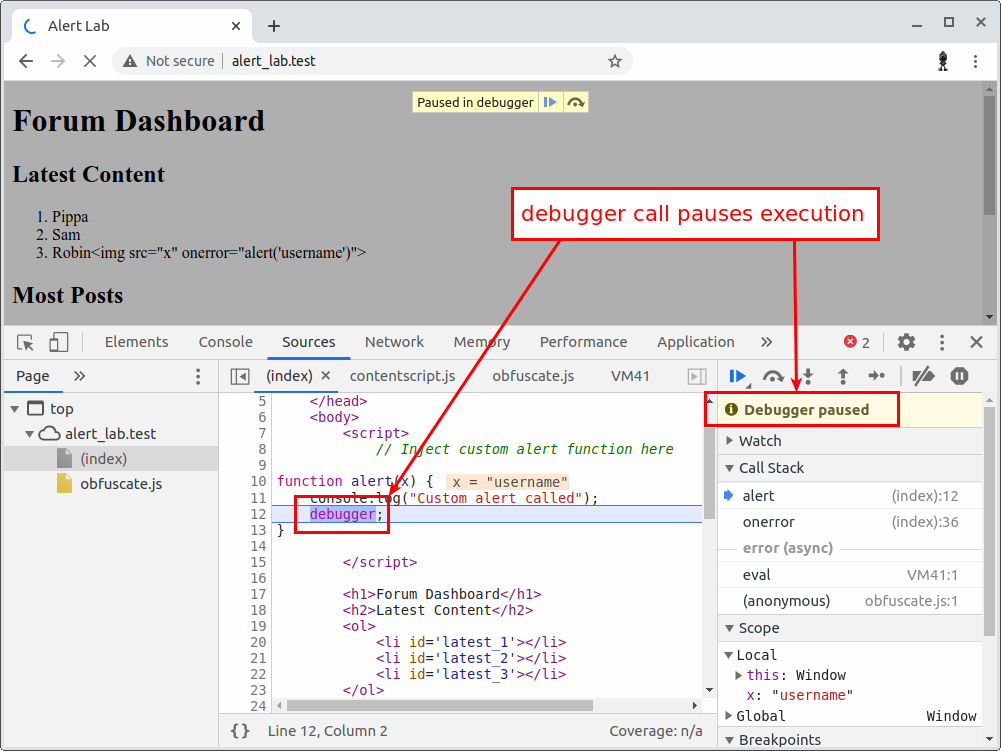
Here is how it looks in Chrome. The breakpoint is triggered by the debugger call:

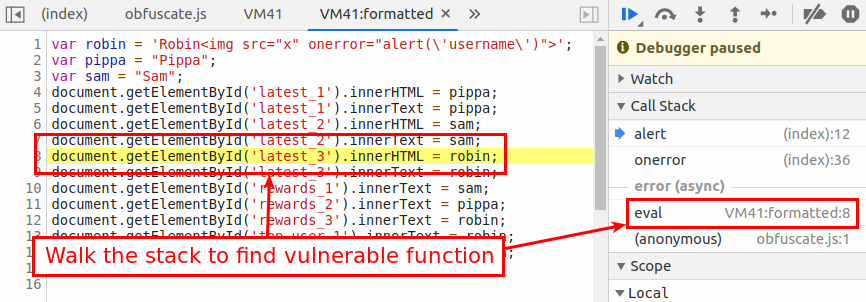
Then walk up the call stack to see where the alert is being triggered:

As you can see, the malicious username is being written into the element with ID latest_3.
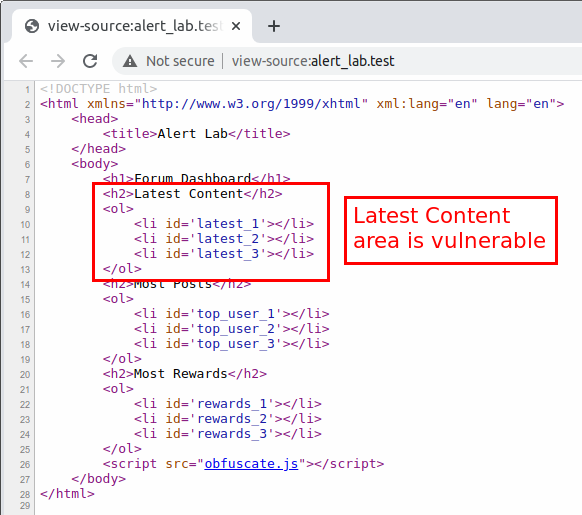
Looking at the page source, you can see that it is the latest content field that is vulnerable.

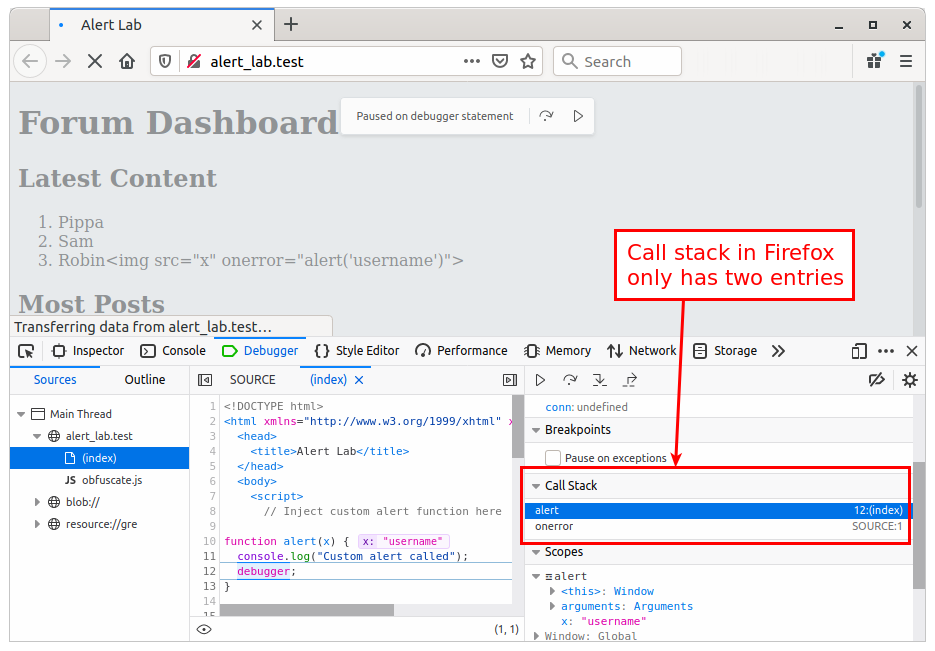
Normally I do my testing in Firefox, but this time I was testing out the new Chrome browser built into Burp. It turns out I was lucky, because when I tried to get some screenshots for this post using Firefox I found that Firefox only goes as far back as the onerror call, and not all the way back to the innerHTML which added the content to the page.
This is where the deubgger call triggers the breakpoint.

And the top of the call stack is the alert function.

So, a quite cool little hack to get the client more information on their vulnerability. Just make sure you are using Chrome if you want to try it out.
If you would like to have a go at this to see how easily it works, I've created the Alert Lab, a simple single page app which has a mysterious XSS alert which you can use this technique to track down.
And before anyone comes in with "Well, you could have just changed the username", I couldn't, I've oversimplified the issue for this description, there were quite a few constraints in the original test and time was limited. This hack took me a couple of minutes and got me exactly what I needed. If you do have

